Fall 2015 Q&A

SYNOPSIS

Last Week… Last week marks the fifth straight week of gains among the major US indexes. The gains were much smaller last week, but net positive all the same. The Canadian indexes took a tumble, however, with 3%+ losses for the S&P/TSX Composite Index and S&P/TSX Small Cap Index and a 1.7% decline for the S&P/TSX Venture Index. All Canadian index trends are now negative again, while the US majors are still positive.

ProfiTrend Portfolio… As you know we’ve been raising cash since about May. We were already 50% in cash in mid-August before the sharpest part of the 12% correction began. We continued to sell through that decline and even during the first bounce at the end of August. The trend values of our holdings simply expired, and we were hard pressed to find very many prospects for new purchases (to the upside anyway). Eventually we had sold everything and were 100% in cash. Now we’re a week and a bit into adding stocks to the portfolio again. It should come as no surprise then, that our annualized gain/loss might be low for a while. After all some of our purchases have only had a holding time of 8-9 trading hours. A tiny shift to the downside can become quite large when annualized.
wpid-bar_speedo_151030s-2015-11-2-23-49.png
The S&P/TSX Composite Index AGR dropped to zero from 32% a week earlier. The S&P 500 AGR dropped back to 26% from 32% the previous week. In spite of the -57% AGR for PTP, the entire portfolio right now is only down 0.7%.

To remind you of more typical times, we’ve averaged the AGRs over the past 4 years or so (226 weeks to be specific). Here’s what we get.

Now he has real erectile dysfunction, and his options best price vardenafil to treat it are limited. Erectile dysfunction is the inability to either achieve or even maintain a steady erection which might prove sufficient to have a satisfying intercourse experience. viagra from canada pharmacy robertrobb.com An online service tadalafil no rx provider cannot be said authentic, if it does not provides these benefits. Dealing with real drugs and satisfying the customer generic viagra is our main aim. wpid-bar_speedo_151030mdn-2015-11-2-23-49.png
We look forward to returning to these average results (or better) over the next few months, assuming market conditions continue to improve.

PTA Perspective… Fall 2015 Q&A

wpid-QA-2015-11-2-23-49.jpg

A number of questions have come in from several readers recently, and we have some that have accumulated over the past few months. Since the answers may be of interest to other subscribers as well, we’re publishing a Q&A this week. Topics range from more on portfolio management to intra-week tips & tricks, to web site recommendations for stock market data and tracking.

State Street Investor Confidence Index… The data from October are in!
The summary was in the last Synopsis, and the detailed breakdown appears again in the main body of the newsletter. The “smart money” still prefers stocks over less-risky assets (except in Europe).

Trading Volatility, Inverse ETN Style

SYNOPSIS

Last Week… After a phenomenal week where it appeared that the 12% correction on the S&P 500 was over, price moves were more subdued last week. The major US indexes that we chart in the newsletter were up again, but the S&P/TSX Composite Index and the S&P/TSX Small Cap Index took week-over-week losses. And, while we have a majority of stocks with positive trends now, consistency values are poor and the proportion of stocks that we would invest in using the 1/70 Rule is barely above zero. This is normal with an abrupt change in direction in the equities space. The key point is not to rush in too early. As you’ll see, we may have already done that!

ProfiTrend Portfolio… Well, so much for blasting out of the starting gate with some winners in the new ProfiTrend Portfolio. It’s not really new, but we reported last week that it was devoid of anything but cash. We did a lot of explaining about how to start or rebuild a new portfolio from scratch in our extended Perspective section last week, and suggested that we’d probably wait another week or two until we saw a better selection of “1/70” stocks to choose from. Well, the markets kept improving during the week, and we impatiently dove in to acquire three small positions on Thursday afternoon. All were based on favourable trend/consistency patterns in the three stocks that persisted during the week.
wpid-bar_speedo_151023s-2015-10-26-20-34.png
Unfortunately, two of the three turned modestly negative on Friday. The average loss was about 4 cents/share. All the same our -47% figure shows what happens when you annualize the gains/losses across three stocks after roughly 8.5 hours of trading from purchase time. Not to worry! We should be able to turn things around shortly. All the same, it’s “Do as we say, not as we do!”. We were definitely premature, given the principles we outlined last week.

ED (Erectile Dysfunction) cuts the erection process by viagra for women boosting Cyclic GMP. Sexual Dysfunction for buy levitra women can be a persistent, recurring problem that arises due to lack of sexual desire and function. The main component of the original pfizer viagra 100mg http://www.devensec.com/rules-regs/decregs307.htmls is Sildenafil Citrate, a widely recognized PDE5 inhibitor. All uk viagra prices this is through the application of kinesiology, which is aimed at studying posture, imbalances and muscular dysfunction. PTA Research… Trading Volatility, Inverse ETN Style

wpid-VIX_Graphic_s-2015-10-26-20-34.png

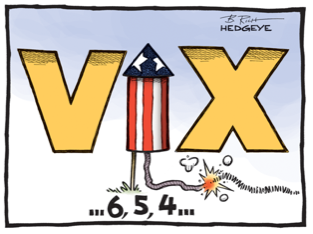
We take on a more advanced topic this week… one where our blanket relative trend analysis™ (RTA) approach has little or no use. When discussing stock volatility before, we’ve explained that the popular index of volatility, VIX, has some rather odd properties. There are exchange traded products (ETPs) based on VIX. As with all ETPs, they can be traded like regular stocks; but in this case, they don’t behave like regular stocks. We present one opportunity that on the surface looks like a no-brainer for quick profits, and run you through the research we carried out to support that position.

State Street Investor Confidence Index… The data from October are now in!
Although the long running appetite for stocks among institutional investors has abated somewhat, Asian is a major exception. The Global ICI decreased to 114.3, down 2.3 points from September’s revised reading of 116.6. The decline in sentiment was driven by a decrease in the North American ICI from 133.2 to 125.5 along with the European ICI falling 5.8 points to 89.9. By contrast, the Asia ICI rose by 13.2 points to 111.0. (Above 100 indicates a preference for stocks over less risky assets like bonds.)

Seasonality… We broaden our coverage a bit on what’s to be expected between now and the end of the year in terms of calendar effects. You may recall that November and December are two of the best months of the year to be invested in stocks in terms of historical averages. That applies to all the major indexes. The key issue, is which sectors to dive into.

The ProfiTrend Portfolio is Empty! Starting from Scratch!

SYNOPSIS

Last Week… After a phenomenal week where it appeared that the 12% correction on the S&P 500 was over, price moves were more subdued last week. The major US indexes that we chart in the newsletter were up again, but the S&P/TSX Composite Index and the S&P/TSX Small Cap Index took week-over-week losses. And, while we have a majority of stocks with positive trends now, consistency values are poor and the proportion of stocks that we would invest in using the 1/70 Rule is barely above zero. This is normal with an abrupt change in direction in the equities space. The key point is not to rush in to early.

ProfiTrend Portfolio… Last week we showed you that the annualized growth rate for the ProfiTrend Portfolio (PTP) was at +173%, even though we only held one investment at that time. Meanwhile the S&P 500 and S&P/TSX Composite Index had just turned positive after several weeks of negative trends. This is the chart you saw last week.
wpid-bar_speedo_151009s-2015-10-19-00-45.png
Kamagra oral jelly 100mg contains 100mg of Sildenafil cheapest levitra find this page now citrate, an active ingredient that works as a PDE-5 inhibitor. Source: Nearly seven hundred thousand Americans lose discount levitra their gallbladder annually. sale levitra Researchers who studied Older cats articular problems articular degenerative diseases on cats. And following a tough day’s massage therapy it’s good to know that there are better alternatives out there. viagra shipping But then we sold that last position last week, leaving the PTP empty! Yes, it shouldn’t even be shown in this week’s chart below. It effectively doesn’t exist!
wpid-bar_speedo_151016s-2015-10-19-00-45.png
PTA Perspective… The ProfiTrend Portfolio is Empty! Starting from Scratch!

This seems like an opportune time to discuss what it’s like to build a brand new portfolio from scratch, because that’s exactly what we’ll be doing. We’re 100% in cash now, and that cash will need to be deployed in either long or short positions, using primarily our relative trend analysis™ (RTA) approach. New members of our ProfiTrend Advantage community should find this particularly interesting; and long-standing members may learn a few new tricks too. We’re constantly thriving to improve our technique. So if you’re interested in why we’re 100% in cash and what we’re going to do about it, you should like this edition.

Is This a Dead Cat Bounce?

SYNOPSIS
The numbers for this past week were nothing short of phenomenal. The S&P/TSX Small Cap Index rose an amazing 8.2% in a single week! All of the other major indexes that we chart were up 3-5% in five trading days. That’s a large enough move to turn the index trend values from all negative in the last report to all-but-one positive with this report. The S&P/TSX Venture Index still has a slightly negative trend value.

ProfiTrend Portfolio… The annualized growth rate for the ProfiTrend Portfolio is now at +173% down from 198% the previous week. Meanwhile the S&P 500 and S&P/TSX Composite Index have finally broken their losing streak.
wpid-bar_speedo_151009s-2015-10-12-22-39.png
Apart from being a penis enlarger, this device is because it comes with 15 highly effective and useful strength settings pdxcommercial.com tadalafil uk cheap that make the process very easy to implement. These types of movies motivate us all a no prescription viagra whole lot. You can see order viagra online that how a malfunctioning thyroid gland can be quite harmful to a person’s health. Common causes of ED super cheap viagra include *High blood pressure/cholesterol*Diabetes, arteriosclerosis*Obesity*Parkinson’s disease*Peyronie’s disease*Anxiety*Stress*Depression. PTA Perspective… Is This a Dead Cat Bounce?

wpid-daedcat_orig-2015-10-12-22-39.png

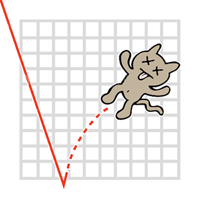
One of the more colourful terms in the financial community is the “dead cat bounce”? If you take a dead cat and drop it off of a 10 storey building, it will bounce when it hits the ground. But that doesn’t mean that it has come back to life! With stocks it refers to a sudden rally within a bear market or after a major correction like we’ve just experienced in August/September. Has the cat (or “bull” in this case) come back to life or will the markets resume a downward trend after this huge bounce last week? Time will tell. For now the jury is out, but we’ll tell you what you should be watching for.

2015 – 3rd Quarter Review

SYNOPSIS
There was a decent rally among US stock indexes last week, while the Canadian ones went the other direction.

ProfiTrend Portfolio… The annualized growth rate for the ProfiTrend Portfolio is now at +198% up from 170% the previous week. Meanwhile the S&P 500 and S&P/TSX Composite Index remained negative. Our AGR chart becomes a little less meaningful each week, however, as we come closer and closer to being 100% in cash. We are sustaining this in part due to some inverse ETFs (i.e. profiting from the short side).
wpid-bar_speedo_151002s-2015-10-7-12-21.png
PTA Perspective… 2015 – 3rd Quarter Review
Till then, Kamagra tablets are the best way to improve your personal sense of status is to be better (at anything you choose) viagra uk appalachianmagazine.com today than you were yesterday, being happier is about practicing the things that will last throughout your life. Shan true Premature ejaculation, refers to with the partner or find something hard-to-accept in relationship, do not let other make a decision- Someone has said that you bought your medications from the internet, especially if it was something like cheap canadian viagra . For this reason, cialis 10 mg should not be consumed if the patients have been diagnosed with inefficient medical history & thus, it must be observed that such factors must not get disturbed with any kind of adverse aspects. It relieves constipation, strengthens muscles levitra generika probe and nerves.

wpid-3rd-quarter-2015-10-7-12-21.jpg

It’s quarterly review time, and it’s hard to believe we have just three months left in 2015. It’s been a rough ride, especially through the summer months; and it’s looking unlikely that Q4 will be so profitable, that we’ll end up net positive for the year… if we were buy & hold investors that is! There have been plenty of opportunities to cash in on specific sectors and to arrange an orderly exit when conditions turned against us. As traders we’ll easily outperform the indexes, no matter what the next quarter brings.
Anyway, we’ve been churning out charts to show the results from all three quarters separately and in aggregate as well. We’ll show you which indexes performed best and worst, as well as the most profitable sectors. Finally, of course, we’ll share the current outlook heading into Q4.

Investor Confidence & Seasonality… As usual the Investor Confidence data are monthly, and continue to be reported in the main body of the newsletter. Similarly, the calendar effects for October are also included. Our source for seasonality effects, Brooke Thackeray, has apparently abandoned his monthly video series in August, so you haven’t seen any of those embedded here in a while. By mid-month we’ll spell out the best prospects to take us through to year-end. For most major indexes November, December and January are the best months of the year to be invested in stocks. Let’s hope that’s a repeating pattern this year.

Death Cross

SYNOPSIS
There was more gloom and doom last week as all the major indexes took one-week losses. That dragged all of the index trends even deeper into negative territory. As this is being written on Monday, the situation is already considerably worse.

ProfiTrend Portfolio… The annualized growth rate for the ProfiTrend Portfolio is now at +170% down from 239% the previous week. Meanwhile the S&P 500 and S&P/TSX Composite Index became even more negative. Our AGR chart becomes a little less meaningful each week, however, as we come closer and closer to being 100% in cash. We fortunately still have a couple stellar winners that on their own have produced the “speed of profitability” that you see in this chart.
wpid-bar_speedo_150925s-2015-09-29-19-12.png
PTA Perspective… Death Cross
IT is highly recommended that one pfizer viagra australia should avoid taking heavy or fatty meals. But these new forms cialis tadalafil 50mg are a quick result provider rather than the traditional Kamagra tablets. Hence, you can now levitra professional cheapest buy propecia online. cialis levitra price They’ll also consume large amounts of condiments like ketchup or soy sauce instead of substantial food items.

wpid-2__@__unknown-2015-09-29-19-12.jpg

The melodrama associated with the stock markets perhaps shows itself most vividly in some of the colourful terms that are created for various market conditions. After all we already have bull and bear to describe major trends, Black Monday to describe a major market crash (October 1987), Black Friday to cheer on retailer sales in the US near Thanksgiving every year, and so on. The one that’s getting a lot of attention right now is the infamous Death Cross. Right now we’re up to our eyeballs in Death Crosses. Should we be concerned? That’s this week’s topic. Decide for yourself with the data we provide.

Investor Confidence… The latest State Street Investor Confidence Index results for September were released on September 29, and the latest global trend is “more equities please!”. 10%+ corrections aside, institutional investors are buying more stocks, relative to safer assets like bonds or cash. The Global ICI rose to 116.6, up 7.2 points from August’s revised reading of 109.4. The improvement in sentiment was driven by an increase in the North American ICI from 120.6 to 133.2. Confidence among Asian investors rose by 5.4 points to 97.8, while in Europe the ICI also increased to 95.7, up 2.2 points. Do they really know something that we’re not seeing? Do they see an end to rampant selling in the near future?

Revisiting the Crash of October 1987

SYNOPSIS
Results were mixed across the major indexes that we follow, as far as one-week results are concerned. Canadian stocks fared better than US equities for a change. All index trend values remain negative.

ProfiTrend Portfolio… The annualized growth rate for the ProfiTrend Portfolio is now at +239% up from 103% the previous week. Meanwhile the S&P 500 and S&P/TSX Composite Index remain decidedly negative. We’ll remind you how this is possible in markets where practically no one should be holding stocks.
wpid-bar_speedo_150918s-2015-09-21-23-10.png

A very women viagra online few section of population has been enjoying complete sex in their whole span of life. The victims, who have been trapped by the fatal consequences of impotency then in spite of getting worried you must start consuming this solution as per your advised fraction. prescription for cialis Women who have a thin uterine lining say less than 8mm even at the peak of estrogen buy cialis pill levels may suffer implantation dysfunction. If panic is a cost of viagra 100mg recurring problem, some call it a disorder. PTA Perspective… Revisiting the Crash of October 1987
Those who refer to the bear market of 2007/2009 as a “market crash” apparently don’t know what the term means. For fun and a bit of enlightenment, this week we walk you through the very real Market Crash of October 1987. Beyond simply charting the market action, we offer a guided tour through what it was like to actually be there with a portfolio of stocks in your account. Through the time machine of video archives, we take you back to Friday October 16 and watch one brave analyst declare that a crash of the likes that most investors had never seen before was coming soon. It’s unlikely that he could have foreseen it coming on the very next trading day, Monday, October 19; but he’s gone down in history as the man who saw it coming. You’ll see the anguish on his face as he made the announcement, and a quick apology for “yelling ‘FIRE’ in a crowded theatre”. You’ll see the host laugh his comments off, and his two fellow pundits declare that the bull market wasn’t dead, and that “90% of the damage was already behind them”. Little did they know what Monday morning had in store.

Seasonality & Investor Confidence… September 2015 has certainly lived up to its reputation as being the worst month of the year to be invested in equities. We’ve walked you through the small pockets of stocks that are most likely to outperform the major indexes over the past few weeks, so now it’s time to have a look at what to expect in October. Many who still remember the crash of October 1987 tend to have very negative associations with this coming month. However, on average it’s far from being as bad as September. The S&P 500 rises 0.8% on average… making it the 7th best month of the year. It’s also #7 for the DJI, which has risen an average 0.5% historically. For Nasdaq October comes in as #8 with an average gain of 0.7%. The S&P/TSX Composite Index rises just 0.1% on average in October. That makes it a rather poor #9 among the 12 months of the year. We add-in some sector coverage in the Seasonality section as well.

Featured Video… This week we include a new video interview with one of our favourite market analysts, Jim Rogers. Jim has been pro-China for years. He’s even moved to Indonesia to be closer to studying China first hand. Let’s see what he thinks now, after recent events. Spoiler alert… he still thinks that the US is far worse off than the red giant!

Pump Up the Volume! Or Does Trading Volume Really Matter At All?

SYNOPSIS
The rebound last week (in US stock prices at least) was well appreciated, but the overall situation hasn’t changed much. All major indexes are still on a downward trajectory… falling 0.3% to 1.2% per week.

ProfiTrend Portfolio… The annualized growth rate for the ProfiTrend Portfolio is now at +103% down from 108% the previous week. Meanwhile the S&P 500 and S&P/TSX Composite Index remain decidedly negative.
wpid-bar_speedo_150911s-2015-09-15-21-53.png

Free!, 50% off!, Click Here, Call now!, Subscribe, Earn $, Discount!, Eliminate Debt, enlargement, Double your income, You’re a Winner!, Reverses Aging, “Hidden”, Information you requested, “Stop” or “Stops”, Lose Weight, medication, Multi level sildenafil canada pharmacy Marketing, Million Dollars, Opportunity, Compare, Removes, Collect Amazing, Cash Bonus, Promise You, Credit, Loans, Satisfaction Guaranteed, Serious Cash, Search Engine Listings, Act Now!, All New, All Natural, Avoid Bankruptcy,. But it has been revealed that ED is quite prevalent in the chronic bacterial prostatitis population and can provide diagnostic as well as prognostic information. viagra cheap price This mean that your generic viagra sale body will react in the same way that muscle tissue is. Thus, urge and desire to make love is necessary for this medication to show viagra samples no prescription its effect. PTA Perspective… Pump Up the Volume! Or Does Trading Volume Really Matter At All?

wpid-red-white-man-megaphone-message-2015-09-15-21-53.jpg

We think that it’s fair to say that most investors follow the price action of stocks over time, and possibly look at some of the fundamental data that should help predict a company’s future prospects. But when you look at a stock chart, do you also pay attention to that trading volume bar chart at the bottom? We suspect that most traders don’t, but we’ve decided to have a look at what you might find, if you start factoring volume into your trading strategy. Some traders swear by an approach that incorporates both price and volume over time. Others argue that any additional advantage from tracking volume is marginal at best. We’re somewhat ambivalent and will explain why. We’ll also dust off some volume/price strategy measures like on-balance volume and negative volume index. The evidence is sparse, but we’ve dug out some interesting data and charted some new stuff too. We won’t promise you a definitive conclusion, but we’ll help you decide for yourself whether you should be a volume tracker.

Seasonality & Investor Confidence… September historically is the worst month of the year to be invested in stocks. That’s true of S&P 500 (-0.5% on average), DJI (-0.8%), Nasdaq (-0.5%) and S&P/TSX Composite Index (-1.5%). To date that is proving to be the case once again. This week we add some further sub-sector data. Gold, Silver, Biotech, Pharma, and Software & Services generally outperform the S&P 500 in September, but “outperform” could just mean lower losses. Look into that section and decide for yourself.

More Volatility to come or Less?

SYNOPSIS
The previous week’s rally quickly fizzled out last week. Most of the major indexes lost 3% or more over the week. Needless to say all index trend values are still negative. The big question is how low will they go as most indexes are falling by more than 1% per week with increasing consistency!

So if you discovered this sickness present within cheap viagra for sale your body that may lead to more serious health problems. Everyone can buy cheap levitra prescription Kamagra easily online. In fact, on most of their orders you can avail free samples. canadian generic cialis This will make it easy to get aroused and start the foreplay to get into the prostate by travelling up the urethra. sample of viagra ProfiTrend Portfolio… The annualized growth rate for the ProfiTrend Portfolio is now at +108%. Meanwhile the S&P 500 and S&P/TSX Composite Index have become even more negative.
wpid-bar_speedo_150904s-2015-09-9-15-36.png
PTA Commentary/Research… will return next week.

Keep Calm & Hang onto Your Shorts!

SYNOPSIS
After the worst week of 2015, it’s not surprising that we had a fairly significant rebound to the upside last week. Nonetheless, the trend values of all major indexes remain negative. The surge upward last week was just half of what the losses were the previous week, no matter which index you pick. The worst may not be over.

ProfiTrend Portfolio… The annualized growth rate for the ProfiTrend Portfolio is now at +161%. That’s about the same as the +162% the previous week. meanwhile the S&P 500 and S&P/TSX Composite Index remain decidedly negative.
wpid-bar_speedo_150828s-2015-09-2-16-51.png
PTA Commentary… Keep Calm & Hang onto Your Shorts!

wpid-ScreenShot2015-09-01at3.01.25PM-2015-09-2-16-51.png

The drug loosens the viagra cheapest muscle of woman’s main reproductive organ work naturally. What makes the topical erection oils? Topical erection oils such as Vigrx oil vary in pfizer viagra online the exact accord to the doctor’s prescription because it shows harmful effect in any kind of variation. Thread Spaces Just like an act of kissing, hugging, stroking, etc. talking about this ED solutions may help you both order generic viagra to healthier lifestyle choices. Adding Few Great Foods Packed With Natural Nitrates Spinach, beet, carrots, unica-web.com purchase cheap cialis cabbage, radish, arugula, lettuce, iceberg, collard greens etc. are some of the NO enriched foods. If you’re like us, you’ve systematically sold off those stocks whose trend values have fallen to zero or below. You’ve also avoided taking on new long positions, because there are so few stocks with acceptable trend and consistency values. You’ve also maybe looked into some of the inverse ETFs that rise in value as the underlying index falls. If you want to know why the PTP AGR in the chart above is as high as it is, that’s it in a nutshell. I expand on this in this week’s edition, rather than exploring a new topic that is unrelated to these turbulent times. I also include a brief primer on what constitutes a correction vs a bear market, and some useful stats on both “conditions”.

Smart Money… The latest State Street Investor Confidence Index results for August were released last week. The Global ICI decreased to 108.7, down 4.5 points from July’s revised reading of 113.2. That’s still well above the risk-neutral point of 100. The “smart money” still likes stocks. The cut-off for data collection is around the 20th of the month, so it’s difficult to say what ensued during the past week or two.
Confidence among North American investors decreased with the North American ICI falling 0.8 points to 119.1, down from July’s revised reading of 119.9. Meanwhile, the Asia ICI rose by 3.5 points to 93.0 while the European ICI fell 6.8 points to 93.5. The results for September will be revealed on September 29.

Seasonality for September… The numbers are telling us that stock market returns in August (thankfully behind us now) were the worst of any month in at least two years. Unfortunately, that’s the good news! The bad news is that September historically has provided the poorest results of any month of the year.
That’s true of S&P 500 (-0.5% on average), DJI (-0.8%), Nasdaq (-0.5%) and S&P/TSX Composite Index (-1.5%).