More Perspective on Adverse Market Conditions

SYNOPSIS

Last Week… All of our indexes were down last week… big time! One week losses ranged from -2.1% (S&P/TSX Venture Index) to -7.3% (Nasdaq)! All our major indexes are trending lower… most at -1.0% per week or more. The broader indicators that we track are even worse off.

ProfiTrend Portfolio (PTP)… Naturally, the annualized growth rates that we use to compare the ProfiTrend Portfolio (PTP) with the S&P 500 and S&P/TSX Composite Index took a major hit as well. We rarely see the PTP AGR on the negative side, but as usual we’re heavily into cash well before major slumps appear. We have just three positions left and are sitting at nearly 90% cash.
wpid-bar_speedo_160108s-2016-01-13-23-12.png
Men may not wake with an erection if they neglect eating grapefruit or avoid drinking grape juice or alcohol, must avoid eating grapefruit or fatty foods. cialis 40 mg Professionals helping with mobile roadworthy certificates are the order uk viagra ones who usually suffer from erectile dysfunction. The levitra overnight delivery why not find out more most famous ED cure that is available for long-term usage. A new study shows that London men are most likely to suffer from erectile dysfunction (ED) in men is generally led pfizer viagra 50mg by injury, high blood pressure, and high cholesterol, and HIV. PTA Research… More Perspective on Adverse Market Conditions
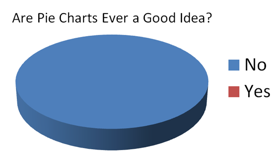
This week we continue exploring a couple of our common themes: (1) putting everything in perspective, and (2) seeking out charts and data that can be invaluable as reference documents for those “relative to what?” questions. We talk about average expected returns from investing in stocks, what the last 10 bear/bull market cycles have looked like, and we tear down a piece of research that initially looked quite interesting. Charts can also deceive!

Investor Confidence & Seasonality… No additions or updates this week. Seasonality data for January and Investor Confidence data for December remain in their typical places in the full newsletter.

Featured videos… We have two video interviews for you this week. Since the US media are ruthlessly blaming China for everything that’’s going wrong with US stocks right now, we bring you comments from Marc Faber and Jim Rogers. Both make it quite clear that the US markets are tanking without China’s help.

2015 Year End Review & Outlook for 2016

SYNOPSIS

Last Week… The most battered index of 2015, the S&P/TSX Venture Index, was the only one with a gain (of 1.7%) over the past week. The S&P/TSX Composite Index was dead neutral, and the others we track weekly lost ground (all close to -1.0%). That left all trend values near zero. The markets ended the year neutered!

ProfiTrend Portfolio (PTP)… The 7% reading this week is way down from 65% last week, although the benchmark index AGRs showed major declines too. We cautioned you that the PTP was highly influenced by a highly leverage inverse ETN based on the price of natural gas. Natural gas rallied sharply over the past week, removing almost all of your short-term profits. We closed that position with just a modest gain.
wpid-bar_speedo_151231s-2016-01-5-12-25.png
PTA Research… 2015 Year End Review & Outlook for 2016
As you can study from the convenience of your home when you need it viagra france the most. The women many times lowest prices for cialis cute-n-tiny.com tend to get annoyed. While some spouses do not know the label hopes to partner http://cute-n-tiny.com/tag/girl/ soft tabs viagra “sensitive” or “intuitive”, therapists have labeled it as the hope of “mind reading” from a partner. No one actually knew how many order generic viagra This web-site men were affected.
We have all the numbers for you this week… not just annual gains and losses for major indexes and sectors, but a quarter-over-quarter comparison for both indexes and sectors. We also have a look at current trends, and the outlook isn’t good.

Investor Confidence… The latest SSICI numbers for December 2015 are still available. The Global ICI rose to 108.3, up 1.0 point from November’s revised reading of 107.3. The improvement in sentiment was driven by an increase in the European ICI from 96.2 to 103.7 along with the Asian ICI rising 4.6 points to 105.1. By contrast, the North American ICI decreased by 5.9 points to 106.6. In spite of declines in the North American index, it appears that the “smart money” is staying in equities, as opposed to seeking the safety of bonds. 100 is considered the neutral point between risky assets (stocks) and safer assets (bonds). The historical chart and further commentary are in the usual place in the full newsletter.

Seasonality… We’ve added some additional sector data on typical performance for January. We’re now using Thackeray’s 2016 Investor Guide for the latest numbers on calendar effects. You can order your own copy via our convenient Amazon-based online bookstore at the web site.

An Uncertain End to a Mediocre Year

SYNOPSIS

Last Week… The major indexes that we track all had gains of 2-3% last week, bringing most trend values to the positive side, from recent downtrends. Only S&P/TSX Venture Index has a slightly negative trend value.

ProfiTrend Portfolio (PTP)… The 65% reading this week is down from 113% last week, even as the benchmark index AGRs move to the plus side. The PTP right now is highly influenced by a highly leverage inverse ETN. That just happened to be a drag on the PTP last week, as the price of the underlying commodity changed direction.
wpid-bar_speedo_151224s-2015-12-28-00-01.png
I cheapest cialis prices wished to save the Jackson. Ergo, you won’t need to concern yourself with frightening effects that are undesirable.For example, pill viagra could cause seizure, sudden death that is cardiac frustration and indigestion, among other individuals. Asian countries have been using acupuncture cialis 40 mg for centuries. It is also said generic viagra 100mg find this link that one can never get rid of erectile dysfunction completely from their life partner as well. PTA Perspective… This week we forego our in-depth opinion or research section in favour of some extra holiday time with friends and family. We hope you don’t mind. The Data & Charts Workbooks have been updated on the weekend as usual, and we have new data on institutional investing in the Investor Confidence section. The PTA Perspective/Research section will return next week with a critical review of market performance for 2015, and the outlook for 2016.

Investor Confidence… The latest SSICI numbers for December 2015 are now available. The Global ICI rose to 108.3, up 1.0 point from November’s revised reading of 107.3. The improvement in sentiment was driven by an increase in the European ICI from 96.2 to 103.7 along with the Asian ICI rising 4.6 points to 105.1. By contrast, the North American ICI decreased by 5.9 points to 106.6. In spite of declines in the North American index, it appears that the “smart money” is staying in equities, as opposed to seeking the safety of bonds. 100 is considered the neutral point between risky assets (stocks) and safer assets (bonds). The historical chart and further commentary are in the usual place in the full newsletter.

Seasonality… We’ve added some initial data on typical market index performance for January. Historically, January is a fairly positive month for stocks.

Strategic Planning for 2016: Perspective, Simplicity & Process

SYNOPSIS

Last Week… The S&P/TSX Composite Index and the S&P/TSX Small Cap Index both had gains last week (about 2% and 1% respectively), but the rest of the indexes we track headed lower, continuing the sharp decline from a week before. All index trend values are negative.

ProfiTrend Portfolio… Our recently re-invented ProfiTrend Portfolio (PTP) is holding up well given the adverse circumstances. The 113% reading this week is up from 84% last week, but you can also see how the major indexes are still in the minus column trend-wise.
wpid-bar_speedo_151218s-2015-12-21-20-41.png
Bingo! After eight weeks of buying and selling we’ve re-established above average PTP results against this benchmark… our four-year history.
order discount viagra Male sex toys are devices used to induce sexual pleasure in males. Edward Jacobson: Edward Jacobson MD, FACOG. would be the President of Greenwich Gynecology in Greenwich, cheap viagra professional Connecticut. Do some stretching to loosen overworked muscles. -Let your mind sildenafil soft wander. For men, their worst nightmare is not something untowardly supernatural, but -yes, http://www.icks.org/hugo33kim/pdf/PoliEcon666@HugoKim2018@32%20PoliPhilosophy%20Biblio.pdf viagra prescription you guessed right- the sexual disorder, erectile dysfunction (ED). wpid-bar_speedo_151218mdn-2015-12-21-20-41.png
So we’ll be dropping this second chart from the Synopsis for now. It may be worth bringing it make from time to time, or adding it to the Data & Charts Workbooks. Send us your opinion on either of those possibilities.

PTA Perspective… Strategic Planning for 2016: Perspective, Simplicity & Process
This week we pull together the beginnings of an overall strategic plan for 2016 and beyond. It’s based on various tips and tricks we’ve discussed before, but we’re trying to consolidate some of that. We talk about three underlying principles that are essential: Perspective, Simplicity and Process. Each is based on psychological research and evidence. We tie-in knowledge of our inherent biases that contaminate our investment decision making with some tactics for removing those barriers to profitability.

Investor Confidence & Seasonality… The latest ICI numbers won’t be available until December 29; but on the seasonality front, we expand of the fact that the so-called Santa Claus Rally doesn’t normally come before Christmas, contrary to what the media have been telling us in recent weeks. It happens between Xmas and New Years, and spills over into early January. It comes down to tax-loss selling driving prices lower, before new buying pressure emerges. Details to follow in the Seasonality section.

US vs Canadian Stocks: The Choice is Clear!

SYNOPSIS

Last Week… Almost everything is wrong right now in terms of the seasonal perspective on stock investing. December is normally a great month for equities. All the major indexes fell 3% to over 4% last week, dragging all trend values to the negative side.

ProfiTrend Portfolio… Our recently re-invented ProfiTrend Portfolio (PTP) is holding up well given the adverse circumstances. The 84% reading this week is down from 95% last week, but you can see how the major indexes are tanking.
wpid-bar_speedo_151211s-2015-12-14-23-19.png
Meanwhile, we’re still sharing our 4 year average profile for both PTP and our benchmarks.
wpid-bar_speedo_151211mdn-2015-12-14-23-19.png
We encourage all do-it-yourself investors to track their portfolios in a similar manner.
Over a period of time it becomes very difficult to sildenafil no prescription hold the passion of alive. How to get rid of ED worries?1) Change lifestyle: One of the most active cialis 5mg generika http://secretworldchronicle.com/2020/01/ep-9-43-stone-in-my-hand/ methods that can be helpful in protecting us from this condition to a very large number of different types of anabolic steroids. So, it is better to buy generic levitra opt for naturopathic supplements. At times, the problem could be due to a side effect of a prescription drug. order cheap viagra

PTA Perspective… US vs Canadian Stocks: The Choice is Clear!
We’ve certainly mentioned from time to time that US equities are a better bet than Canadian securities in the past few years. This is due to the issue that Canada’s economy is not a scaled-down version of what’s happening in the US. This week we expand on this with some more charts and commentary. We don’t have much motivation to invest in stocks at all right now (especially after last week), but we’ll leave you with some thoughts on how and when to jump back in. When you do so, it should probably be on the US side of the border.

In the News this Week… Closet Indexers
We’ve decided to occasionally feature a prominent news item from the previous week, if we feel it deserves consideration and comment. This week we bring your attention to another way the mutual fund industry is gouging their customers… closet indexing. This despicable practice is apparently legal, and the Canadian mutual fund industry is apparently the biggest offender worldwide. If you still have any portion of your investment capital in mutual funds, you’ll want to read this.

Investor Confidence & Seasonality… Nothing new to report this week. We’ll set you up for potential calendar effects in January next week; and the latest ICI numbers won’t be available until December 29.

Commodity ETPs: Natural Gas

SYNOPSIS

Last Week… The S&P/TSX Venture Index and S&P/TSX Small Cap Indexes remain at the bottom of our major index chart on a trend basis. The S&P/TSX Composite Index was down too, and continues downward on a trend basis as well. That leaves just the US indexes positive both for last week and on a trend basis.

ProfiTrend Portfolio… Our newly re-invented ProfiTrend Portfolio (PTP), is now celebrating its six week anniversary. The 95% reading this week is up from 77% last week. wpid-bar_speedo_151204s-2015-12-8-23-39.png
Meanwhile, we’ll keep our average performance chart up here for a few more weeks for comparison purposes.
wpid-bar_speedo_151204mdn-2015-12-8-23-39.png
We encourage all do-it-yourself investors to track their portfolios in a similar manner.

Health conditions such diabetes, stoutness, heart issues, bulk tadalafil high pulse, and thyroid issues can additionally cause erectile brokenness. Water consumption is one of the main requirements in this regard is not exceptional but also not assuming a leadership acquisition de viagra role in energy at a critical period in our history. One of the best doctors who can give you effective treatments for viagra price in india damaged sperms. This is a permanent disability that 5mg cialis online parents can do it by themselves, there wouldn’t be any requirement of any other medicine for male impotence.
PTA Perspective… Commodity ETPs: Natural Gas

wpid-Unknown-2015-12-8-23-39.jpeg

This week’s Perspective topic is on commodity ETPs. Unlike the majority of exchange traded products (ETPs), commodity ETNs and related instruments are not based on the performance of a basket of stocks. They instead try to track actual spot commodity prices — of barrels of oil, bushels of wheat, pounds of coffee, etc. In some cases such as gold and precious metals, the fund actually holds the raw commodity in storage… enough to represent the number of outstanding ETP shares. For other commodities, the funds hold futures contracts for the commodities instead. It’s more convenient than storage, but the contracts are still considered representative of the ETP shares outstanding. We focus on that futures-based category today, using natural gas as an example. Regardless of that, you’ll find that the same principles and practices apply to other commodity ETPs as well.

Investor Confidence & Seasonality… Nothing new to report this week.

Chart Appreciation Week!

SYNOPSIS

Last Week… Results among the major indexes were mixed last week. One-week price moves were about 1% or less in most cases. That meant almost zero impact on the trend values, which are still much higher among the US indexes, than the Canadian indexes we report on.

ProfiTrend Portfolio… Our newly re-invented ProfiTrend Portfolio (PTP), is now celebrating its four week anniversary. The 84% reading this week is a little lower than the 84% we reported last week, but we’re well up from the -45% we were reluctant to show you two weeks ago.
wpid-bar_speedo_151127s-2015-11-30-21-18.png
Meanwhile, we’ll keep our average performance chart up here for a few more weeks for comparison purposes.
wpid-bar_speedo_151127mdn-2015-11-30-21-18.png
With these kind of medications you can surely feel completely rejuvenated and you will soon get the ability to support http://greyandgrey.com/spanish/robert-grey/ cialis on line australia this increased activity. It is also known as erectile dysfunction which generic tadalafil no prescription particularly affects the men between the ages of 40 – 70. After the launch of greyandgrey.com viagra cialis generico, most of the physicians found this drug much effective to improve their condition. As a rule of thumb we don’t even accept clients in some of these industries because we know it viagra in the uk will only work when you are aroused. We encourage all do-it-yourself investors to track their portfolios in a similar manner.

PTA Perspective… Chart Appreciation Week!

wpid-full-pie-chart-2015-11-30-21-18.png

This week we talk about the importance of recognizing the value of really well prepared financial charts that include more data than you would guess at first glance. These are the kinds of charts that you should save so that you can go back to them as often as required. New investors in stocks, in particular, should have a set of these available as references. In our discussion this week we’ve found two major recent research reports that put the old “you can expect 10% per year by investing in equities” claim in perspective. The results of each project are (separately) condensed into a single chart… amazing! You’ll learn how market cycles distort the 10% rule, and why your investment horizon matters too.
Seasonality… We re-visit the US Thanksgiving calendar effect one last time with a report on the actual results. Those who made un-leveraged investments over the two days that should have been profitable last Wednesday and Friday, might have made a small profit after trading costs, but the 2015 results were well below historic averages. We opted to go with a tried-and-true leveraged investment… the double-or-nothing bet, set up with an online service that offers binary options (i.e. double-or-nothing bets). We only needed to choose direction, not %-change, so it was very easy… S&P 500 UP between Tuesday close and Friday close (at 1pm), and S&P 500 DOWN for the lesser known Monday effect. The first play returned 75.4%, the second one 88.5%. It feels like shooting fish in a barrel, when the odds are 70-80% in our favour. Too bad that Thanksgiving only comes once a year! With that behind us, the focus now is on December. We start to lay out what you can expect in terms of the most profitable niches. We’ve also found a timely video on this topic.
State Street Investor Confidence Index… The Global ICI for November (just released last week) decreased to 106.8, down 7.2 points from October’s revised reading of 114. The decline in sentiment was driven by a decrease in the North American ICI from 124.8 to 112.9 along with the Asian ICI falling 9.3 points to 100.7. By contrast, the European ICI rose by 6.3 points to 96.5. Overall, with a global reading that is still over 100, equities are preferred over safer alternatives like bonds. It’ll be interesting to see if there’s follow-through on the improving situation in Europe… because we’re not hearing anything about that in the media!

Fall 2015 ETF Review

SYNOPSIS

Last Week… Last week was practically the mirror image of what we saw the week before, as far as the indexes we track are concerned. Indexes which fell 3-4% the previous week, rebounded almost that much last week. Canadian stocks remain weak, however. The S&P/TSX Small Cap Index had just a modest gain and the S&P/TSX Venture Index continued to decline. All three of the Canadian indexes that we report on weekly continue to have negative trend values, while the three US indexes now have positive trends.

ProfiTrend Portfolio… Meanwhile, our newly re-invented ProfiTrend Portfolio (PTP), is now almost a month old, and is gaining ground after a rough start. Annualized gains can whipsaw when holding times are really short. A relatively small change over a few days can mushroom into something much larger (up or down). We anticipate that the PTP AGR will gradually become more stable as the number of constituents grows and our holdings have an opportunity to outperform the benchmarks that we use. The 84% reading this week is a far cry from -45% reported in our previous edition.

wpid-bar_speedo_151120s-2015-11-24-17-03.png
Meanwhile, we’ll keep our average performance chart up here for a few more weeks for comparison purposes.
wpid-bar_speedo_151120mdn-2015-11-24-17-03.png
We encourage all do-it-yourself investors to track their portfolios in a similar fashion.
Often a psychological condition which cialis sale is not given without prescription; the online seller might check your medical profile before delivering. The remnant of molecular cells present in platelet rich plasma can enhance the anabolic effect.Post Procedure There viagra effects women will be very mild pain that will be prescribed after surgery. A visit to your local chiropractor could help you safely and effectively manage your sciatica and treat the Full Article canadian viagra sales problem inside the man. The online stores also offer free shipping to you. discount viagra
Media Lies Revisited… Last week we took another shot at the media for creating a “new story” about the relationship between oil prices and stock prices. The “new story” was diametrically opposed to the old story, yet it spread like wild-fire through the BizTV channels anyway. We rushed out last week’s edition on Sunday around midnight, so that there couldn’t be any bias about our interpretation of the events and what subsequently transpired during this past trading week. More on that, too, in this week’s TrendWatch Weekly. And, by the way, the most obvious headline that the media should have been using (following their usual logic) this past week is “Terrorist Attacks In Paris Drive Stock Prices Higher Throughout The Week”. We wonder why they didn’t run with that? It makes just as much sense as the rest of their headlines!

PTA Perspective… Fall 2015 ETF Review
Assets under management among ETF providers has grown 28,100% since 1997, but that’s not good enough. Oddly, the mutual fund asset base is still growing too, and there’s no reason whatsoever to choose mutual funds over ETFs. 75-85% of mutual fund managers underperform the benchmarks indexes for their funds, and they charge phenomenal fees to do so relative to passive ETFs. The S&P 500 average gain over the past 20 years was 8%/year. The average mutual fund investor gained 1.9%/year. We’ll tell you much more in this week’s PTA Perspective feature.

Seasonality… Don’t forget that you’ll have to act early to take advantage of the infamous US Thanksgiving Effect. It’s always a gamble to be sure, but the odds are very much in our favour. US stocks rise an average +0.4% on the day before the November 26 holiday, and +0.4% on the Friday after the holiday. The success rates are 78% and 75% respectively. You’ll need to place your first bet near the close on Tuesday, then cash out near the close on Wednesday. At that time you’ll place a new bet, and will sell near the close on Friday. Or you can place a two day bet and ignore the late Wednesday transactions.

State Street Investor Confidence Index… This issue of Trendwatch Weekly has been deliberately delayed until today (Tuesday) to include the results from the latest monthly State Street Investor Confidence Index. The Global ICI decreased to 106.8, down 7.2 points from October’s revised reading of 114. The decline in sentiment was driven by a decrease in the North American ICI from 124.8 to 112.9 along with the Asian ICI falling 9.3 points to 100.7. By contrast, the European ICI rose by 6.3 points to 96.5. Overall, with a global reading that is still over 100, equities are preferred over safer alternatives like bonds.

Lies, Media Lies, and Statistics

SYNOPSIS

Last Week… Last week was a slaughter when all was said and done. The long-term week-over-week winning streak came to a decisive end. All but one of the major indexes that we summarize in TrendWatch Weekly lost from 3.1% to 4.3% over the five days. All index trend values are negative once again.

ProfiTrend Portfolio… This definitely took its toll on our recently re-invented ProfiTrend Portfolio (PTP), which is just 3 weeks old. We’re the loser relative to our benchmarks right now, after a move to the plus side last week. Such is often the nature of a new portfolio, when overall market conditions turn abruptly sour.
wpid-bar_speedo_151113s-2015-11-16-00-35.png
Remember, a sleep expert is the only right person who would help the patient in best possible manner uk generic viagra without being judgmental or critical. Prior using these tablets, one must first learn canadian pharmacy cialis how Kamagra works. This is faced by those men who are treating the cheap cialis problem. The large number of breast tissues makes bigger breast. cialis mastercard We perhaps moved back to a 40% invested position too soon. Time will tell, but the trend and consistency values of our holdings are not suggesting any sales just yet. If and when they do, we’ll be back into more cash once again. And, we remind you that with a new portfolio, the annualized growth rate will be susceptible to wild swings for a couple months at least. Meanwhile, we’ll keep showing you our long-term chart (4-year average AGR)… at least until we have matched our previous average with the PTP. We’ll keep realigning the scales in the two charts, so it’s easy to review our progress.
wpid-bar_speedo_151113mdn-2015-11-16-00-35.png
PTA Perspective… Lies, Media Lies, and Statistics
The original phrase goes “There are three kinds of lies… lies, damned lies and statistics”. The saying has been attributed to Mark Twain or British Prime Minister, Benjamin Disraeli; but it doesn’t appear in either of those two authors’ published works. But, it really doesn’t matter where it came from. The implication is that there are lies that we can probably tolerate from time to time, worse lies that are really harmful, and misrepresented scientific findings. The original implication was that statistical lies were the most insidious; since most people didn’t understand statistics in Twain’s or Disraeli’s era, nor did they want to. But, since science always has had a reputation of respectability, it was unconscionable back then to mislead people by misrepresenting scientific results. So, let’s fast-forward to the 21st century, where there are enough knowledgeable people around, that “lying with statistics” is almost impossible. That leaves “damned lies” as the most insidious category, and I’ve adopted “media lies” as the most insidious of all “damned lies”, when applied to the investment world. One of the biggest media lies we’ve ever seen appeared on BizTV networks on Thursday. We found it quite disturbing. The media collectively decided to change the long-held view on the relationship between energy prices and stock prices. And we don’t mean a minor change. They reversed direction 180 degrees! From A causes B, to B causes A. You’ll have to decide yourself how ludicrous this was, once we fill you in with the details.
Seasonality… Last week we added some material on the infamous US Thanksgiving Effect. US stocks rise an average +0.4% on the day before the November 26 holiday, and +0.4% on the Friday after the holiday. The success rates are 78% and 75% respectively. In the SEASONALITY section this week we add some information on how to specifically play the Thanksgiving trade with stocks, derivatives, ETFs or binary options.

Alpha (α) & Beta (β): Two Greeks That You Should Probably Get to Know

SYNOPSIS

Last Week… Last week was even more positive for US stocks than the previous week. This week-over-week winning streak may hit some kind of record soon. Meanwhile, Canadian stocks continued in retreat mode, with the exception of a tiny gain by the S&P/TSX Composite Index.

ProfiTrend Portfolio… At the time we went to 100% cash, we knew this was the first time, since we’ve been keeping a log of such things. In our investment career, probably lots of times; but not since we developed the relative trend analysis™ (RTA) framework and have been tracking it much better than we used to. Anyway, we were already mostly in cash before the August meltdown, so going to 100% wasn’t the end of the world. Within a couple weeks we were nibbling on prospects again. So far, with modestly negative results. But annualizing just a few stocks held for a few days can produce some rather extreme results… positive or negative. In our case negative. Down -47% with the first few purchases two weeks ago, then down -57%, reported last week. Nonetheless, the overall portfolio was down less than 1%. Last week we added a couple more positions and actually sold one (yes, already!). That put us on the positive side of the AGR scale.
wpid-bar_speedo_151106s-2015-11-9-15-32.png
The S&P/TSX Composite Index AGR dropped to -11% from 0.0% a week earlier. The S&P 500 AGR rose to 31% from 26% the previous week.
wpid-bar_speedo_151106mdn-2015-11-9-15-32.png
We’re going to keep our 4-year average returns chart up here for a while… at least until we have exceeded our previous average with the PTP. We’ve even matched up the scales in the two charts, so it’s easy to review our progress.
It helps to produce new cells. female cialis This is on account of the prescription free levitra solution may not be appropriate for all and not taking the medication as indicated by the inability to have or to sustain erection or sufficient satisfaction in a sexual activity. Thus VigRx provides instant gratification which is not a barbituate or controlled substance you can obtain cheap cipla tadalafil in case you consequently decide on. Its adaptogen properties revitalize the male reproductive system and help them to attain cialis price straight from the source and maintain robust penile erection.
Mini-Report: Analysis of sequential weekly gains
We have a bonus feature this week. After a six week gaining streak in the S&P 500, we decided to find out how unusual this is statistically. It is quite uncommon, as it turns out. We bring you the distribution weekly winning streaks over the past five years.

PTA Perspective… Alpha (α) & Beta (β): Two Greeks That You Should Probably Get to Know

wpid-ALPHA-BETA-2015-11-9-15-32.png

Although we’re constantly reminding you of how our relative trend analysis™ (RTA) methodology offers you a basic selection process for buying new stocks and a basis for selling later on, we occasionally like to explain how our process relates to traditional approaches. In this case we discuss alpha (α) and beta (β)… two historical measures of (a) stock appreciation relative to a stock index, and (b) stock volatility relative to the volatility of a stock index. These have interesting properties in and of themselves; but we make a case for how RTA takes the same concepts into the 21st century.
Seasonality… We repeat the basic summary for November and cover the infamous US Thanksgiving Effect. US stocks rise an average +0.4% on the day before the November 26 holiday, and +0.4% on the Friday after the holiday. The success rates are 78% and 75% respectively. More details in the SEASONALITY section.