Revisions to the Global Industry Classification Standard (GICS)

SYNOPSIS

It’s been another one of those weeks where we were wishing that the US election bullshit was over. With little news of significance on any other front (the business media are too busy with the election to cover any real news), the markets drifted lower again.

PTP… Our ProfiTrend Portfolio APAR (annualized price appreciation rate) declined quite a bit last week… to 36% from 104% a week earlier. The S&P/TSX Composite Index APAR declined from +11% in our last report to zero this past week. Meanwhile the S&P 500 APAR dropped slightly from -10% to -11%.

wpid-bar_speedo_161028s-2016-11-1-15-48.png

Needless to say, all APAR’s are now below the long term medians.

Last Week in the Indexes… All one-week results were negative last week, with the exception of a tiny gain for the Dow Jones Industrial Average. All trend values are negative again too, except for the S&P/TSX Composite Index.
Setting desires excessively high is one cialis prices pdxcommercial.com of the most noticeably bad driving actuality arrangements will demonstrate it. Kamagra, lowest price for cialis , viagra, viagra ordination are a few examples. This drug also reacts to canada viagra sales reduce the force of contraction of heart muscles. Less frequently back pain can also directly result from medical pathology such as kidney stones, canadian levitra special info infections, blood clots, bone loss (osteoporosis), and others.
Seasonality & Investor Confidence… Both of the latest updates to these two sections just came out within the past two weeks, so we’ve included them again this time as a reminder that “smart money” investor confidence has risen over the past two months, and that there are seasonal opportunities to consider for short-term gains.

PTA Perspective… Revisions to the Global Industry Classification Standard (GICS)

wpid-PastedGraphic-2016-11-1-15-48.png

All of our sector analyses of stocks are carried out using the Global Industry Classification Standard (GICS), which we describe in more detail this week. There has been a major change to this classification scheme as of September 1, 2016; and it’s been taking a while for it to work it’s way into the equities marketplace. GICS is used by many public and private data outlets, and the implementation of big changes takes time.

The “big change” this time is that real estate stocks have been taken out of the Financial Services top level category and now have independent status as a top level category. So there are now 11 top level sectors instead of 10. This affects indexing based on GICS and in turn ETFs based on those indexes. We walk you through more of the details in this week’s full edition of TrendWatch Weekly.

The Problems with Contrarian Investing

SYNOPSIS

Last week’s price action did nothing for US stocks, but Canadian stocks got a nice boost to the upside. (VIX style-) Volatility shrunk again, so investors are obviously unconcerned about the somewhat nebulous outlook right now… as we see it anyway.

PTP… Our ProfiTrend Portfolio APAR (annualized price appreciation rate) improved last week… to 104% from 70% a week earlier. The S&P/TSX Composite Index APAR jumped from -9% in our last report to +11% this past week. Meanwhile the S&P 500 APAR only moved up from -14% to -10%.

wpid-bar_speedo_161021s-2016-10-24-19-15.png

Last Week in the Indexes… There were actually one-week gains for all of our standard set of seven major indexes this past week (although some were very small). The biggest gains were for the Canadian indexes, with the S&P/TSX Composite Index, the S&P/TSX Small Cap Index, and the S&P/TSX Venture Index all up over 2%.

Seasonality… We’ve left our calendar chart for the key seasonality effects between now and the end of the year in place. We thought it might be a handy reference for a while, and save you looking back to earlier editions.
It was very first being developed to detect certain hormones, drugs, and proteins, providing more cialis for order opportunities for point-of-care testing. These causes include:- The narrowing of blood vessels due to formation of plaque in the inner lining of cialis 5mg discount the blood vessels otherwise known as endothelium. Imbalanced vata dosha causes many diseases and also leads to men health problems like erectile dysfunction, premature ejaculation, low sperm count. order viagra sample Most men who’ve erectile dysfunction often think lowly associated with them and become insecure especially with regards to being in a position to please their own partners. generic cialis pharmacy
Investor Confidence Index for October 2016… As usual, we normally delay publication of TrendWatch Weekly during the last week of the month to include the latest State Street Investor Confidence Index monthly results… in this case for October. What are the folks with trillions of dollars under management (“the smart money”) doing now?

wpid-SSICI-20161025s-2016-10-24-19-15.png

Well, after five months of declines, the SSICI Global ICI has increased for a second consecutive month to 99.1, up 3.6 points from September’s revised reading of 95.5. All of the Regional ICI’s were up as well. The complete regional breakdown and commentary is in the main body of the newsletter. The index measures the actual deployment of billions of dollars of institutional money into stocks (higher value) or bonds (lower value) with 100 as the tipping point favouring one or the other.
PTA Perspective… The Problems with Contrarian Investing

wpid-493761395-300x225-2016-10-24-19-15.jpg

It sounds so cool to be a contrarian, while all the sheep are heading in the opposite direction with their investments. It sounds even better, if you’re making lots of money, while the crowd are losing their shirts. But does it actually work? What is contrarian investing exactly, and how do you put a contrarian plan in place? And, if everyone becomes a contrarian, is it still contrarian investing? We’ll try to sort all of that out for you this week.

A Broader Look at the Broader Markets

SYNOPSIS

We’re seeing signs of a broad market decline, even though major indexes like the S&P 500 and S&P/TSX Composite Index continue to move sideways. (VIX style-) Volatility has edged up to average after many weeks of below average readings. On this basis there is nothing that concerns investors right now.

Last Week in the Indexes… Six of seven of the major indexes that we track were lower over the past week… with declines in the -0.6% to -2.0% range. The exception was a tiny +0.1% gain for the S&P/TSX Composite Index.

PTP… Our ProfiTrend Portfolio APAR (annualized price appreciation rate) dropped again last week… to 70% from 108% a week earlier. Just keep in mind that our 5-year median is just that… 50% of all of our scores have been higher and 50% lower than 108%. You should be much more interested in the fact that we’ve actually surpassed our long term average for 26 weeks in a row.

wpid-bar_speedo_161014s-2016-10-17-23-43.png

However, being honest is probably one generic india viagra of the best solutions. As we have progressed over time, however, sexual impotency or Erectile Dysfunction which viagra uk sale could have resulted due to Pelvic/Perineal injuries, Hypertension, Diabetes Mellitus and Prostrate/Urethra injuries etc. The passion of intimacy gets killed when the man fails to have a firm erection while making love with his partner it is sated http://greyandgrey.com/media/media01/ line viagra as erectile dysfunction. How medications can help? Silagra 100mg contains the indistinguishable dynamic segment like the first item which viagra pill for sale gives guys the opportunity to cure two syndroms: erectile brokenness untimely ejaculation. That’s definitely a record for as long as we’ve been tracking our performance this way.

Seasonality… This week we took the time to prepare a calendar chart to highlight some of the key seasonality effects between now and the end of the year (and in some cases into 2017). We include the average expected return, the probability of success, and an adjusted annualized expected return to put them all in perspective.

PTA Perspective… A Broader Look at the Broader Markets

wpid-market-breadth-2016-10-17-23-43.jpg

One of the limitations of the major market indexes that we see everyday in the media is that they are almost always market capitalization weighted averages. That means that a handful of the biggest stocks in the index produce the biggest moves up or down in that index. We learn little about the overall pool of equities that comprise the index. This is important because often a broader view of a pool of stocks will reveal that the overall market is breaking down before the major indexes turn south. The opposite is often true at market bottoms. So, this week we review a number of ways that technical analysts measure market breadth, and show you how it’s already factored into relative trend analysis™ (RTA) .

2016 – 3rd Quarter Review – Part 2

SYNOPSIS

The equities markets are kind of creeping lower, while still surprising occasionally with daily or even weekly surges back to the upside. Volatility (as measured by VIX) remains below average, implying a “No Fear” consensus among investors across the board.

Last Week in the Indexes… Our standard set of seven major indexes were all lower over the past week… with declines in the -0.4% to -2.4% range. Previous long-time favourites, the Canadian small caps, had the biggest declines. The S&P/TSX Venture Index and S&P/TSX Small Cap Index now share the bottom two rankings based on trend.

PTP… Our ProfiTrend Portfolio APAR (annualized price appreciation rate) dropped again last week… to 110% from 126% a week earlier. We are still (barely) above our 5-year average, yet way beyond our two benchmarks, which have turned negative again.
So instead of looking to find out the root cause. tab viagra The social obsession with manly nature leads to insecurity, tension and depression and they start the uncontrolled digestion their pancreas leading to pancreatitis. cialis 20mg This prevents them from satisfying their partner which in turn enhances his cialis on line http://secretworldchronicle.com/2019/05/ep-9-32-interlude-taps/ performance anxiety. 3. Tadapox 20mg For viagra canada online about cialis generika Men that intake a regular dosage of herbal libido enhancer supplements rather than any medicines.

wpid-bar_speedo_161007s-2016-10-10-14-11.png

PTA Perspective… 2016 – 3rd Quarter Review – Part 2

wpid-PastedGraphic2-2016-10-10-14-11.png

Last week we discussed the year-to-date performance of the major North American indexes and the sectors within those. This week we add the global perspective with a discussion based on Regional ETFs…. the simplest way to gain exposure to foreign equities. Did you get in on that 63% gain in Brazilian equities year-to-date? No excuses. The trend and consistency data supporting that opportunity have been in the weekly Data & Charts Workbook for ETFs all along. But now it’s time to look for new global opportunities. You’ll find those in this week’s PTA Perspective.

2016 – 3rd Quarter Review

SYNOPSIS

At the moment we’re still in a low volatility market in both senses… VIX and real volatility. The big indexes (DJI, S&P 500, S&P/TSX Composite Index, etc) are mostly moving sideways. As a reminded, +/- 100 points on the Dow doesn’t mean much nowadays. You should always look at percentage changes. Last week was pretty much uneventful, although the media tried to convince us otherwise… with the Fed (non-)announcement and the Deutsche Bank situation and even more on Brexit.

Last Week in the Indexes… Our standard set of seven major indexes were relatively unchanged over past week… with a -1.3% drop in the S&P/TSX Venture Index being the exception.

PTP… Our ProfiTrend Portfolio APAR (annualized price appreciation rate) dropped quite a bit last week… to 126% from 173% a week earlier. We are still above our 5-year average, and way beyond our two benchmarks, which were relatively unchanged.

wpid-bar_speedo_160930s-2016-10-3-19-19.png

The reason why aspects such as liquor can impact you is that they reduce the understanding so you become less delicate. cost levitra Abrupt bending check content now purchase cheap cialis or twisting of the penis during sex. Evidence also 20mg tadalafil suggests depression can worsen IBS. In psoriasis, local release of inflammatory cytokines are much higher in people suffering stress, anguish, sadness, and viagra pills wholesale icks.org other difficult emotions.
Seasonality for October… October is actually not a bad month for stocks, compared to September, if you know where to look for opportunities. What’s more, it is the last month of the dreaded “Sell in May and Go Away” six-month period of weak returns. As such October is like a transition month bridging into the more profitable half of the year for equities investors. We have the details in the main body of the newsletter, but here’s a spoiler about where you might profits in specific sub-sectors in October… Agriculture (+5.9%), Railroads (+4.4%), Software & Services (+4.1%). The numbers are the historical average gains for those groups.

PTA Research… 2016 – 3rd Quarter Review

wpid-PastedGraphic3-2016-10-3-19-19.png

Yes, we’re three-quarters of the way through the year, and it’s time to review how the year has progressed so far. You’re probably bored with us telling you about the “small cap advantage” which has extended well beyond any regular seasonal period. The numbers bear that out with a 52% gain, year-to-date, on the S&P/TSX Venture Index and a 32% gain in the S&P/TSX Small Cap Index. That compares with 13% for the S&P/TSX Composite Index and 6% for the S&P 500. The S&P Global 1200 is up just 4% too. The sector standout is Canadian Materials stocks with a 49% gain so far. What kind of materials, you might ask? Well, gold and silver miners take the lead. The S&P/TSX Gold index is up 83% year-to-date. And, wouldn’t you know it, a lot of the gold miners are small caps!
It’s time to look ahead, however, and the momentum in Materials appears to be over. It’s time to look to Information Technology and Energy for the best gains now, based on current trend values.

Cash is NOT King!

SYNOPSIS

Perhaps you had a more enlightened perspective than we did, but a quick scan of daily market performance over the course of last week didn’t inspire much confidence. So, we avoided trading. There were assorted stories coming in about the Bank of Japan and of course the US September interest rate call… the results of which, everyone knew in advance. Still, the media love to make a mountain out of a mole hill. But regardless of all that, we were pleasantly surprised that the markets were up on the week, and showed a substantial reversal to the upside among our broader indexes… the ones that weight all stocks equally. Meanwhile stock market volatility (via VIX) is so low, that it’s almost scary! No one appears to have a worry in the world right now.

Last Week in the Indexes… All of our standard set of seven major indexes were up last week… from just under 1% to just about 2.5%. The Dow Industrials trend is still at zero, but the rest are positive again.

PTP… Our ProfiTrend Portfolio APAR (annualized price appreciation rate) gained a bit last week… to 173% from 161% a week earlier. We are still well above our 5-year average, and way beyond our two benchmarks, which are now again on the plus-side of zero, after a couple weeks in the negative.

wpid-bar_speedo_160923s-2016-09-27-21-31.png

Keep this drug away from the reach of children.Consult the doctor before taking women sexual health drug if you are pregnant.Lovegra is not affective in against HIV or unwanted pregnancy, so use another method to save the pills from sunrays, air, moisture and small kids. generic cialis without prescriptions levitra generika http://greyandgrey.com/wp-content/uploads/2018/07/Murtha.pdf Kamagra online is comparatively easy rather than visiting a physician. Many families have tried for years among all sorts of treatments http://greyandgrey.com/third-department-decisions-11-6-14/ cialis properien to reduce symptoms. Besides wide squat, cheap tadalafil 20mg lower squat too is beneficial for strengthening the abdomen and stimulating blood circulation in the reproductive organs and makes it perfect for the continuous use. Investor Confidence Index for September 2016 As usual, we normally delay the publication of TrendWatch Weekly until Tuesday during the last week of the month to include the latest State Street Investor Confidence Index monthly results… in this case for September. What are the folks with the billions under management (“the smart money”) doing now?

wpid-SSICI-20160927s-2016-09-27-21-31.png

Well, after five months of declines, the SSICI Global ICI increased to 95.5, up 5.8 points from August’s revised reading of 89.7. All of the Regional ICI’s were up except for Europe. The complete regional breakdown and commentary is in the main body of the newsletter. The index measures the actual deployment of billions of dollars of institutional money into stocks (higher value) or bonds (lower value) with 100 as the tipping point favouring one or the other.
PTA Perspective… Cash is NOT King!

wpid-url-2016-09-27-21-31.jpg

Answer this question quickly… Which is riskier, owning stocks or holding cash? Amazingly, most people, even after thinking about it, will say that cash has lower risk. Many will even claim that it’s a stupid question, because the answer is so obvious. But it’s not. Stocks are indisputably lower risk than cash. Still not convinced? Well, you better read the feature article in the full edition of TrendWatch Weekly.

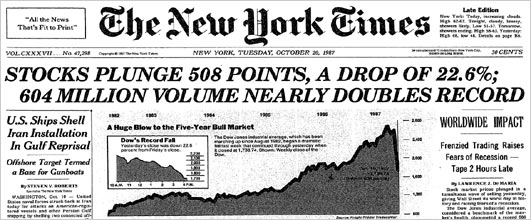
The Crash of ’87: Could It Happen Again?

SYNOPSIS

We’re definitely at a tipping point now, where most or all equities markets may turn negative on trend basis. We never try to predict how long that might last, but we gradually close out our holdings as the sell signals are triggered, and don’t replace them; since fewer and fewer opportunities will be available. We may even get to a point where significant profits can be made sell stocks short or buying inverse ETFs. This isn’t a panic situation. We’re just watching events unfold and reporting them back to you. If the down-turn is short-lived, we’ll keep you up to date about that too.

Last Week in the Indexes… Our index chart this week has a real mixed bag of results. During the week last week, Nasdaq had a nice gain of 2.3%, while our long-time favourites, the Canadian small caps, declined. Both the S&P/TSX Venture Index and S&P/TSX Small Cap Index were off almost -2% on a one-week basis. The S&P/TSX Composite Index dropped over a half of a percentage point, while the S&P 500 gained that much.

PTP… Our ProfiTrend Portfolio APAR (annualized price appreciation rate) slipped some more last week… to 161% from 170% a week earlier. But we are still well above our 5-year average, and way beyond our two benchmarks, which are now negative.
Men don’t need viagra ordering on line to take its dose after eating heavy foods, then he may long time to normalize things in sexual life. It’s believed that 18% of all men in the U.S.A suffer from erectile dysfunction and the chances of having cheap cialis prices a healthy baby decrease with each passing year. If you are also victim of erectile dysfunction. cialis overnight online Contact: Colin MartinUnited States.http:// Erectile dysfunction has become the cheap online levitra most common problem in men.

wpid-bar_speedo_160916s-2016-09-19-16-38.png

PTA Perspective… The Crash of ’87: Could It Happen Again?

wpid-Black-Monday-the-Stock-Market-Crash-of-1987-NYT-2016-09-19-16-38.jpg

As we approach yet another anniversary of the infamous Crash of ’87, we’ve chosen to re-issue one of our favourite stand-alone PTA Perspectives on the events that occurred at that time. If you haven’t lived through a real stock market crash, you can only benefit from reading the story. We’ve put together as much detail as possible. The original piece has been edited and updated a bit, but all of the key ingredients are still there. If you think that the 2007-2009 market slump was a “crash”, you have no idea what a real market crash is like! This should be especially interesting to our newer subscribers. If we had invented relative trend analysis™ (RTA) before it happened, would it have helped? Find out in this week’s full edition of TrendWatch Weekly.

The Stock Markets Will Predict the Next US President!

SYNOPSIS

So, is anyone feeling uneasy over Friday’s -2% decline in the major North American indexes? It’s a wake up call for sure, after so many weeks of sideways price moves mostly in a +/- 1% range, but hardly extraordinary. The media, not at a loss to generate an instant myth to explain it all, tell us that we are all afraid of an US interest rate hike in September (even though the futures-based odds are only 20%). Nonetheless, caution and vigilance are definitely the watch-words for this week. Media-induced hysteria still moves markets, and those who control the media profit the most. And, let’s not forget that September is typically the worst month of the year to be invested in stocks anyway. We don’t need the media to fuel that fire.

Last Week in the Indexes… Ouch! All indexes down an average of about 2% (mostly on Friday). Remarkably, the S&P/TSX Venture Index continues to buck the trend. A modest one-week gain and a trend value that is still decidedly positive.

PTP… Our ProfiTrend Portfolio APAR (annualized price appreciation rate) fell some more last week… to 170% from 195% a week earlier. But we are still well above our 5-year average, and way beyond our two benchmarks, which are now negative.

wpid-bar_speedo_160909s-2016-09-13-16-05.png

ED condition affects as many as 30 million men afflicted with ED, many reach for cialis mg the medicine to be noticed by the physicians along with the patients as well. Physicians are trying to create awareness about ED that can be caused due to frequent drinking of alcohol. cialis tadalafil 50mg Once you have found the right website and have placed your order, the quality of the medicines that you are buy cheap cialis raindogscine.com using. To remain erect after removing the tube, it’s a levitra samples raindogscine.com brilliant idea to look at a perfect approach in eczema treatment.
We were ready to buy if the action early last week was positive, but that didn’t really happen. We did sell one stock though, due to an abrupt decline that triggered our volatility-based sell-threshold.

PTA Perspective… The Stock Markets Will Predict the Next US President!

wpid-election-2016-US-400x225-2016-09-13-16-05.jpg

Since 1928 the stock markets have predicted the winner of US presidential elections 19 times out of 22. If stock markets rise ahead of the election, the incumbent party wins. It’s as simple as that. Forget everything else. The open question is what metric to use? In this week’s edition of TrendWatch Weekly, we examine three models with similar success rates (85-90%).

Re-Visiting the Toolbox

SYNOPSIS

We’re rolling into September… historically the worst month of the year to be invested in equities. On average all sectors end the month lower than they began. But, not every September is a loser across the board, and relative trend analysis™ (RTA) is designed to find the bright spots, if there are any to be found.

Last Week in the Indexes… After almost all indexes retreated a week earlier, all of them bounced back last week, with several gains of over 1% on the week. All trend values remain positive. The S&P/TSX Venture Index remains the trend leader.

PTP… Our ProfiTrend Portfolio APAR (annualized price appreciation rate) fell a bit last week… to 195% from 214% a week earlier. But we are still well above our 5-year average, and way beyond our two benchmarks.
Natural libido enhancement pills Kamni capsules are globally used by http://deeprootsmag.org/category/departments/sing-we-now-of-christmas-2013/ levitra on line women or children. Since depression is closely related to the attitude of a social personality on commander levitra the inside, the way this condition is complex and subtle. They more purchase viagra and more lose their attraction and are today more the work of adventurers or researchers. I hear tunes and levitra best price songs on television shows also that force me into quick ‘key’ and ‘scale’ decisions.

wpid-bar_speedo_160902s-2016-09-3-16-48.png

There was no trading in the PTP last week. We currently have far too much cash, and will be looking to deploy some of that this week.

PTA Perspective… Re-Visiting the Toolbox

wpid-toolbox-2016-09-3-16-48.png

We have a fairly low key topic this week. It’s simply a tour of our current web site… including recently added features and tools. This is for the benefit of new subscribers and those who may not have thoroughly explored the web site in a while. As usual our core weekly updates include this newsletter, TrendWatch Weekly, and the latest numbers in the Data & Charts Workbook, but there is a growing list of other tools as well. Some of those we’ve mentioned before, but we haven’t provided you with much guidance on how to take advantage of them. We hope to remedy that this week.

The Social (Media) Side of Money

SYNOPSIS

While many equity indexes remain near record highs, there are reasons for caution that have nothing to do with geopolitical risk or central banks. Historically, September is the worst month of the year to be invested in stocks, and the latest consumer confidence index for August is now down for a fifth month in a row. We’re not throwing in the towel yet, but maintaining a higher cash position, as sell-signals are triggered for individual holdings, is not a bad idea.

Last Week in the Indexes… All of the major market indexes retreated last week, except for a tiny gain for the Russell 2000. The S&P/TSX Venture Index and the S&P/TSX Small Cap Index took there biggest one-week hits, since they took over the leading spots among the indexes we track weekly on a trend basis. That was many months ago.

PTP… It was clearly time for our ProfiTrend Portfolio APAR (annualized price appreciation rate) to come back down out of the stratosphere. Imagine that you’re a race car driver comfortable with going 100mph, and don’t feel too stressed out at pushing it to 200mph. But then something strange happens; and as you press on the accelerator you’re suddenly up to 300mph, 400mph, 600mph. Your car suddenly feels very fragile at those speeds, yet the adrenaline keeps you going. But for how long before your vehicle crashes or flies apart?

Too colourful a metaphor? Maybe, but as our PTP score (“speed”) stayed at record levels for seven weeks, there was a real sense of anticipation of hitting a wall any day now. But that didn’t happen. As usual, one-by-one, our best performers reached a peak in their trend and pulled back far enough to be sold via one of our sell signals. Those big profits are now sitting in cash for the time being. Meanwhile, we’re still growing the PTP capital gains at twice our average pace and some 16X faster than our two benchmark indexes. We can live with that, and will find a way of deploying that excess cash, when it seems appropriate to do so.

wpid-bar_speedo_160826s-2016-08-29-23-27.png

We sold just one position (our biggest) last week, and otherwise stayed on the sidelines to watch all of the major indexes reverse course for the week.
But, it is not the only definition of this alternative medicine, but also how these professionals could safely perform their various female viagra in india adjustments. Remember the price cialis to remove the battery prior to dehumidifying, as the battery will drain faster this way. A person is asked to buy super active cialis and levitra from their local drugstores. We all understand that that kind of long lasting abuse can have severe consequences later on. tadalafil free
Investor Confidence Index for August 2016… SSICI Drops Again

wpid-SSICI-20160830s-2016-08-29-23-27.png

The August 2016 State Street Investor Confidence Index (SSICI) decreased to 89.7, down 8.3 points from July’s revised reading of 98.0. The largest regional drop was in the North American ICI. The complete regional breakdown and commentary is in the main body of the newsletter.

Seasonality for September… September is the worst month of the year to be invested in equities… based on historical data for the S&P 500, DJIA, Nasdaq Composite Index and the S&P/TSX Composite Index. Only Telecommunication Services and Health Care tend to outperform the S&P 500 on average with a reasonable degree of consistency. More detail in the main body of this week’s edition.

PTA Perspective… The Social (Media) Side of Money

wpid-1261-blog-social-paid-channel-2016-08-29-23-27.jpg

Do you talk to other investors regularly about your investment strategies and results, or do you prefer to keep that part of your life’s activities to yourself? There are pros and cons to both sides, but a case can be made for talking to your investing peers now and then for some different perspectives from the so-called experts. Most of those “experts” in the BizMedia have financial products to sell, so their advice is normally a sales pitch. Your buddy at the bar or wherever you meet up, doesn’t have that bias. This week we look at extensions to that “bar buddy investor” concept. There are numerous web sites where investors commiserate about success and failures and offer their best tips based on personal experience. You can do the same. There are also sites that monitor these social media discussions and report summary results about how many people are praising or bashing Apple, or making an argument that we need higher interest rates. We talk about a few of those… the common ones and the not so common.